ACH Network Volume and Value Statistics

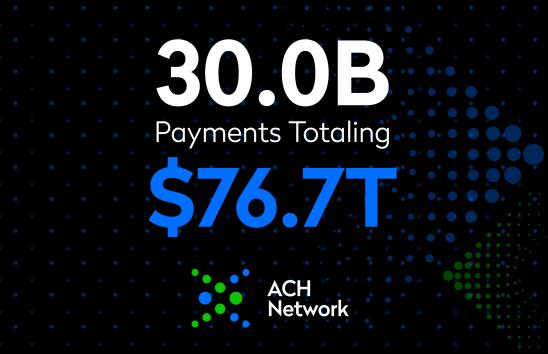
Overall ACH Network Volume
Growing fast. Going strong.
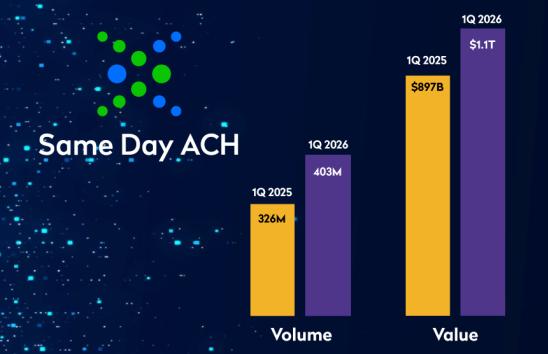
First Quarter 2026 Volume and Value
Full Year & Fourth Quarter 2025 Volume and Value
In 2025, Same Day ACH payment volume reached 1.4 billion payments for the year, valued at $3.9 trillion. From 2024 to 2025, Same Day ACH volume grew 16.7%, while the value of those payments increased 21.4%. Overall, ACH Network payment volume rose nearly 4.9% from 2024 to 35.2 billion payments in 2025, climbing to an average 141 million daily transactions. The value of those payments reached $93 trillion, a 7.9% increase compared to 2024.
The fourth quarter saw significant milestones for the ACH Network. December 2025 saw the ACH Network’s highest-ever monthly volume of 3.22 billion payments, and the highest monthly volume of Same Day ACH payments of 172.1 million. Total fourth-quarter ACH Network volume was 9.1 billion payments valued at $24.4 trillion, respective increases of 5.1% and 8.9% over the fourth quarter of 2024.
2025 Details
YoY Growth:
Payments: 4.9%
Dollars: 7.9%
Total Payments:
35.19 billion
Debits:
19.59 billion
Credits:
15.60 billion
Total Dollars Transferred:
$93.00 trillion
Debits:
$31.68 trillion
Credits:
$61.32 trillion
2025 Details
Business-to-Business:
8.08 billion payments
$63.11 trillion transferred
Person-to-Person:
469.66 million payments
$775.72 billion transferred
Consumer Bill Payments and Other Debits:
17.16 billion payments
$12.04 trillion transferred
Direct Deposit:
8.74 billion payments
$16.49 trillion transferred
Same Day ACH
Time is money.
Governments, businesses and people have embraced the ease and optimal speed of Same Day ACH, leading to sharp growth since its introduction in 2016.
2025 Details
YoY Growth:
Payments: 16.7% Value: 21.4%
Total Payments:
1.45 billion
Debits:
821.25 million
Credits:
626.44 million
Total Dollars Transferred:
$3.92 trillion
Direct Deposit
The most important payments increasingly rely on ACH.
From payroll to Social Security, tax refunds to retirement distributions, the ACH Network transferred 8.74 billion Direct Deposits in 2025.
2025 Details
YoY Growth:
Payments: 1.7% Dollars: 8.9%
Total Payments:
8.74 billion
Commercial:
7.31 billion
Government:
1.43 billion
Total Dollars Transferred:
$16.5 trillion
Consumer Bill Payments
More and more bills are paid with ACH.
This category also includes all consumer purchases and account-to-account transfers, including internet payments—the fastest growing payment channel among consumers.
2025 Details
YoY Growth:
Payments: 4.8% Dollars: 9.9%
Total Payments:
17.17 billion
Payments By Type:
Phone: 804.94 million
Prearranged: 4.86 billion
Customer Initiated: 90.11 million
Internet: 11.41 billion
Total Dollars Transferred:
$12.04 trillion
Internet Payments
As the web grows, so does the ACH Network.
As more and more payments are made online, internet payments continue to be a major driver of overall ACH Network growth.
2025 Details
YoY Growth:
Payments: 6.1% Dollars: 11.7%
Total Payments:
11.41 billion
Total Dollars Transferred:
$6.98 trillion
Person-to-Person
Directly connecting people and money.
More and more payments among consumers are relying on the ACH Network to provide a seamless way to transfer money.
2025 Details
YoY Growth:
Payments: 19.8% Dollars: 21.0%
Total Payments:
469.66 million
Total Dollars Transferred:
$775.72 billion
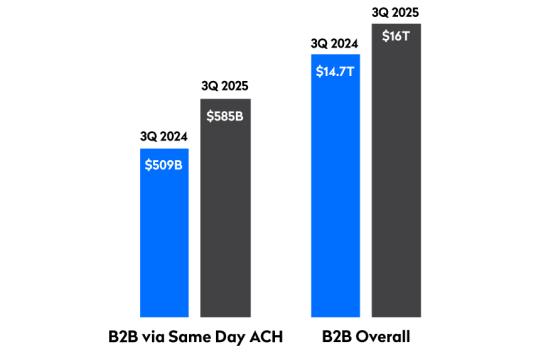
Business-to-Business
Helping business get done.
Companies of all sizes have long relied on the rock-solid ACH Network to receive payments, move funds between accounts, and pay vendors/suppliers. B2B payments are the ACH Network’s most significant growth segment.
2025 Details
YoY Growth:
Payments: 9.9% Dollars: 8.4%
Total Payments:
8.08 billion
Total Dollars Transferred:
$63.11 trillion
Same Day Business-to-Business
Meeting businesses’ faster payments needs.
Large, small and medium-sized businesses need to send and receive payments in a matter of hours. Same Day ACH is meeting these demands, with use-cases including cash concentration, merchant settlement, tax payments and vendor payments.
2025 Details
YoY Growth:
Payments: 5.7% Dollars: 23.5%
Total Payments:
415.05 million
Total Dollars Transferred:
$2.31 Trillion
International
Payments beyond borders.
In a globalized economy, payment networks must keep pace.
2025 Details
YoY Growth:
Payments: -0.1% Dollars: 38.0%
Total Payments:
120.85 million
Total Dollars Transferred:
$374.03 billion
Healthcare
A healthy ACH Network makes payment processing less painful.
2025 Details
YoY Growth:
Payments: 7.3% Dollars: 10.9%
Total Payments:
547.66 million
Total Dollars Transferred:
$2.94 trillion
Top 50 ACH Originators and Receivers
Each year, Nacha releases its Top 50 rankings of financial institution originators and receivers of ACH payments. Past Top 50 data is available in zip files that can be downloaded in the Historical ACH Network Volume section below.
Historical ACH Network Volume
Each of the links below downloads a zip file containing information on ACH Network volume and value for that year. The files also contain an infographic for each quarter, an annual infographic and the Top 50 Originator and Receiver lists.
2024 ACH Network Volume Statistics
2023 ACH Network Volume Statistics
2022 ACH Network Volume Statistics
2021 ACH Network Volume Statistics
Media Inquiry
If you are a member of the media and would like additional information on ACH Network Volume or would like to arrange an interview, please contact Nacha Communications.